Thursday, March 31, 2016

Building a CTA Button Your Leads Can’t Help But Click

It’s the great marketing paradox. We spend hours brainstorming and months testing the copy of our calls-to-action, but whether we ask our users to Sign Up Now, Start a Free Trial, Get Started, Request Access, or Learn More, all we really want them to do it click the button.

Just click the button.

So why do so many of our quality leads fail to comply with our simple request? The way your CTA button is set up on a landing page is just as important as the CTA itself. Otherwise, it’s a button to nowhere.

Make your CTA pop on a pretty page

Visual appeal is everything. Before they see your CTA button, your landing page is the first impression your potential customers will have. Choose attractive, simple imagery – if your page is cluttered, your visitors won’t know where to look. Color scheme also is important: Using complementary but contrasting colors help a page to pop.

Notice how the below example from PopSurvey is coordinated with shades of blue, allowing the pink in the logo and CTA to pop out on the page. The secondary CTA, “Pricing & Sign Up” in the header is a slightly duller pink that still stands out but doesn’t distract from the main call-to-action button.

pop-survey-signup-button

Ensure your page is easy to read and draws the attention of your customers’ eyes – don’t make them strain to read the text. The following landing page from Website Magazine is cluttered, has too many distracting colors, and small text. It’s impossible to know where to look!

website-magazine-disorientied-design

Get to the point

Customers won’t have the patience to stay on your page if they don’t know what you’re offering. Use clear, strong wording to elicit the quick reactions that all good Calls-to-Action invoke.

Active verbs like “join” or “discover” can make people feel like they’ll be a part of something or learn something new. Negative questions like “worried?” and “confused?” can tap into human fears – always an attention-getter. And make it personal and urgent – use pronouns like “your” or “my” to convey ownership, as well as time-sensitive words, as in “Get my free newsletter now.”

At Socedo, one of our landing pages, is frill-free. We’re still A/B testing variations around “Start My Free Trial” or “Start My 14-Day Free Trial.” Regardless, previous testing has confirmed that the phrase “Free Trial” is crucial to our CTA buttons. It’s simple and to the point, and users know exactly what will happen when they click the button. No matter where you look on our site–the landing page, the navigation, or the blog–you’ll see a blue button with the “Free Trial” copy.

But just like any marketing strategy, you should always be A/B testing. What works for one brand might not work for another, and things can change over time.

Lead to the button with benefits

Drive more leads by offering your unique selling point. When a customer clicks on your CTA button, they should know why it will benefit them. Start with a confident headline on the page that conveys a key value you offer, and support it with a subhead that explains it. Follow with clear button copy that encourages users to claim these benefits.

If you’re like everyone else – boring and wordy – you won’t get your customers to pay attention or even to think about clicking your CTA. Add personality, emotions and enthusiasm to help draw in customers.

This landing page from Manpacks is fantastic and hilarious. It has a header with a clear benefit, in this case convenience on men’s essentials. Then the subhead explains exactly what Manpacks offers. By the time the user reaches the CTA button, they already know what they are going to “Get Started” with.

manpacks-homepage-march-2016

Sqord is a fitness and game tracking wristband for kids. Their landing page isn’t bad. It has a coherent color theme that reflects the audience and the product, the button pops, and it gets to the point. The headline is catchy but not very specific, and the subhead only provides a few more surface-level details: “Sqord is your online world, powered by real world play.”

By the time the user reaches the button text “Buy Sqord Membership & Gear” it’s hard to know what they’re actually buying. Is it the wristband, the app, or both? And why should I care?

sqord-homepage-screenshot

Instill fear of missing out

You always want what you can’t have, right? It’s all about urgency. Customers hate missing out on a short-term offer. Focus on deadline phrases such as “limited time” or give them and end date. Add exclusivity to your product, when appropriate, with phrases like “while supplies last.” And CTAs that save money will always be a winning tactic. Customers can’t ignore it.

This landing page from Slope, a visual marketing platform, creates FOMO (Fear of Missing Out) by implying only a limited number of people will be allowed access to the beta. In addition to avoiding this negative, the button creates a positive experience of exclusivity. If you’re one of the select few who request early access, you’ll be part of the inner club–the talk of the town at your next marketers’ get-together.

slope-request-early-access-button

Be creative

You’ll probably notice a pattern to the successful landing page CTAs mentioned here. They all have a high-benefit header, an explanatory subhead, and a button with active verbs. They all have a coordinated color palette, with the button standing out. They all get right to the point.

Most importantly, they all have some level of creativity. You can read as many prescriptive tips for CTA buttons as possible, but at the end of the day, it’s the unexpected element of your page that will give you the edge for higher conversion rates.

About the Author: Aseem Badshah, Founder and CEO of Socedo. Socedo helps sales and marketing professionals leverage social media data to discover, qualify, and nurture leads, automatically.

SearchCap: Travel & retail report, first page bids & more

searchcap-header-v2-scap

Below is what happened in search today, as reported on Search Engine Land and from other places across the web.

From Search Engine Land:

Recent Headlines From Marketing Land, Our Sister Site Dedicated To Internet Marketing:

Search News From Around The Web:

Local & Maps

Searching

SEO

SEM / Paid Search

Search Marketing

The post SearchCap: Travel & retail report, first page bids & more appeared first on Search Engine Land.


from SEO Rank Video Blog http://ift.tt/1PIfij6
via IFTTT

Think cross-channel to build stronger marketing

Inbound. Search. Social. Email. Web. Mobile. Events. A consistent, dependable multi-source experience can help you create ideal customers who spend 2x as much as regular ones.

Get the new Modern Marketing Essentials Guide to Cross-Channel Marketing from Oracle and start creating the most cohesive, valuable, and frictionless customer experience possible.

Visit Digital Marketing Depot to get your copy.

The post Think cross-channel to build stronger marketing appeared first on Search Engine Land.


from SEO Rank Video Blog http://ift.tt/1M3ThRc
via IFTTT

AdGooroo releases travel and retail keyword results after Google’s right rail ad change

google-flight-travel-fade-ss-1920

AdGooroo has released its second look at the impact of Google eliminating text ads in the right rail on desktop search results. The two analyses — one on retail keywords, another on travel keywords — tell similar stories: a reduction in the number of advertisers competing in the auctions, slight increases in cost-per-click on average, but big swings at the individual keyword level.

Across the set of top 20 travel keywords, AdGooroo monitors — comparing February 1-18 to February 19-March 28 — the number of advertisers bidding per keyword fell 15.4 percent from an average of 38 advertisers bidding per keyword to an average of 32. The average cost-per-click (CPC) among the top 20 keywords increased by just 3 cents, on average (5.2 percent), from $2.65 to $2.68.  That said, there was wide variation in performance at the individual keyword level. For example, “cancun all inclusive” CPC rose 35 percent, “car rentals” rose 34 percent.

google right rail ads travel keywords adgooroo

On the whole, click-through rates increased 10 percent across the top 20 travel keywords. Just one keyword (“river cruises”) saw a slight decline of 3.3 percent in CTR.

In its earlier analysis of the top 20 retail keywords earlier this month — comparing February 1-18 to February 19-March 8 — AdGooroo found that competition was cut by 27 percent. The average CPC rose 7 percent with 14 out of 20 keywords seeing increases. However, again, several keywords saw significant decreases in CPC: “mobile phone” was off by 26 percent, “shoes” fell by 14 percent. Then there was the outlier “samsung glaxay 26” which rose by 108 percent.

Meanwhile, looking across 2500 retail keywords, the average CPC increased just 1.8 percent while the number of advertisers competing fell by 42 percent since the change went into effect.

google right rail impact on retail words

The post AdGooroo releases travel and retail keyword results after Google’s right rail ad change appeared first on Search Engine Land.


from SEO Rank Video Blog http://ift.tt/235yfFR
via IFTTT

First-page minimum bids continue to rise in wake of Google desktop SERP changes

google-adwords-bigA8-1920

We’re just about a month out from Google’s sweeping changes to desktop SERPs, in which text ads were removed entirely from the right-hand rail and the number of text ads appearing above organic results increasingly grew to four, where there used to be three.

As we reported a couple of weeks ago, the overall impact of the change hasn’t been dramatic, with at most minimal shifts in CPCs and traffic.

Two observations included in our previous analysis were:

  • Rising first-page minimum bids for non-brand text ads, as the total available ad inventory decreased from a maximum of 11 text ads per page to seven.
  • Decreasing top-of-page minimum bids for non-brand text ads, as the total available ad inventory above organic results increased from three to four for some searches.

In the days since, we’ve seen first-page minimums continue to steadily increase, while top-of-page minimums appear to be back on the rise.

While it’s too soon to attribute these changes precisely to causes, these are the symptoms we would expect if advertisers did get more aggressive with paid search bids as a result of the changes.

Note: All data sourced from samples of Merkle advertisers, which range from medium to enterprise-level businesses.

First-page minimum bids headed up and to the right

Looking at the median change from February 8 through March 16 for a sample of advertisers year over year, we find that first-page minimum bids continue to increase steadily since the removal of right rail text ads.

nonbrand_first_page_minimums_yoy

Looking at the first-page minimum change for 2015 over the same time frame, we find that there was a slight bump in first page minimum bids in mid-March last year.

However, using last year’s data as a gauge for the seasonality of these minimums for the sample studied, it appears most of the increases observed in 2016 seem tied to the desktop SERP changes, as opposed to seasonal increases.

Now, it’s very possible it’s just taking some time for these minimum bid estimates to get fully updated on Google’s end in light of the new auction limits and that there haven’t been any real changes in competition since the updates.

However, it’s also possible that at least some advertisers are upping bids in an attempt to get ads that fell off of the first page of results with the changes to begin showing on the first page again. Google makes this simple with their automated bid adjustments, which can push keyword bids up to the first page minimum. Thus, these steady increases could be linked to more aggressive competition arising out of the changes.

Not everyone could possibly be bidding to the first page all the time, though, or we would see constantly increasing minimums. If advertisers did start upping bids to remain on the first page in the wake of the SERP updates, bids are likely to plateau at some point as advertisers reach the absolute upper limits of how much they’re willing to pay for traffic.

Top-of-page minimum bids headed back up

As mentioned earlier, top-of-page minimums declined after the SERP changes, as there are now more available ad slots at the top of the page, and these estimates continued to decline for about two weeks.

However, during the first week of March, top-of-page minimum bids began creeping back up and are still steadily climbing.

nonbrand_top_page_minimums_2016

Again, because these estimates are provided by Google and may take time to fully update, and search behavior is ever-changing, this recent increase may not speak to the level of competition.

However, combined with the fact that first page minimum bids continue to rise, it also seems possible that advertisers are adjusting bids to get ads to show above the organic results.

Even though bottom ads have maintained most of the click share that went to ads on the side/bottom prior to the updates, top ads have still gained traffic share, which we’ll discuss in more detail later.

Therefore, advertisers may be bidding to the top of the page in order to garner more clicks, and this could in turn increase top of page bid estimates for advertisers.

CPCs up only slightly since updates

Looking at daily year-over-year CPC increases aligned for day of week, we see some slight acceleration in CPC increases over the past two weeks. However, the acceleration is slight enough to be reasonably tied to simple seasonality as a cause.

google_desktop_nonbrand_text_ad_cpc_change

Many predicted that desktop CPCs would rise in the wake of Google’s updates, but a couple of factors likely play into why there hasn’t been a clear-cut increase.

Factors working against CPC increases

1. Google’s requirements to show on the first page and top of page only affect the CPC for some clicks

The role of first-page and top-of-page minimums in the auction is complicated and took me about 10 minutes of fast-paced speaking to explain at last year’s SMX Advanced. In short, however, there are minimum ad ranks required for advertisers to show above the organic results, as well as minimums for an advertiser to show at all. These ad ranks translate to minimum CPCs required for each advertiser to reach the first page of the results and to get to the top of the page.

First-page and top-of-page minimum CPCs might be a pure result of the level of competition. This means that the first page minimum is the bid required to beat out the ad rank of the last advertiser that’s getting featured on the first page, and the top of page minimum is the bid required to beat out the last advertiser being shown above the organic results.

However, for some auctions, these minimum CPCs are required to meet Google’s minimum ad rank, as opposed to beating out competitors, as Google itself requires minimum ad ranks for ads to show at the top of the results or to be featured on the first page at all. This ensures the quality of the ads that are presented to users.

Google’s documentation puts it like this:

The minimum Ad Rank required to appear above search results is generally greater than the minimum Ad Rank to appear below search results. As a result, the cost-per-click (CPC) when you appear above search results could be higher than the CPC if you appear below search results, even if no other advertisers are immediately below you.

For auctions where first page and top of page minimum CPCs are decided by Google’s minimum ad rank, as opposed to the ad rank of the next highest competition, the changes to the desktop SERP impact the CPCs for ads shown in the last position above the organic results and the last ad featured on the first page.

However, for auctions where these CPC floors don’t come into play for the price paid, these changes would not have had an impact on the CPC for the ads shown in those positions.

All of this is to say that the desktop SERP changes very likely directly impacted the price paid for traffic for some keywords that got moved just above the organic results or found themselves in the last ad spot on the page.

However, most clicks are not impacted by minimum bids, particularly first page minimum bids, since most traffic goes to ads farther up the page.

2. Bottom ads are picking up a lot more traffic than most expected

To be honest, when I first heard that side ads were being removed completely and that there would just be more ads at the top and bottom of the page, my first reaction was that pretty much all paid search traffic would go to ads featured at the top of the page.

The likelihood of users scrolling past all of the top of page ads and organic listings to then find a relevant ad at the bottom of the page just seemed unlikely.

This would have driven up CPCs if it were indeed the case that only ads in position 4 or higher got any real traffic.

And yet, it appears that bottom ads are doing pretty well for themselves. Looking at the share of Google.com non-brand text ad traffic by the location on the page, we find that while top ad click share increased about 10 percentage points to ~80 percent with the updates, bottom ads also picked up about 10 percentage points of share to ~20 percent.

google_desktop_nonbrand_text_clickshare_by_pagelocation

This is helping to keep CPCs stable, as traffic hasn’t shifted entirely to the top position ads, which have higher CPCs tied to them.

Conclusion

As mentioned, there haven’t been huge shifts in CPC in aggregate just yet, but you can see from the way first page and top of page bid minimums are moving that the auction has indeed changed as a result of Google’s updates.

It’s still very early to assess the impact from these changes (particularly considering these updates occurred towards the end of what is considered a down period for many retailers after the holidays), and we may yet see more evidence of impacts in the weeks to come or further rollout of serving four text ads from Google’s end. Frankly, it’s too early to call the ballgame.

We’re particularly interested to see if four text ads get served above the organic results more often come the holiday shopping season this Q4. Only time will tell.

The post First-page minimum bids continue to rise in wake of Google desktop SERP changes appeared first on Search Engine Land.


from SEO Rank Video Blog http://ift.tt/1VVzaqh
via IFTTT

From waste to win: watch how a simple change affects AdWords performance

burning-money-ss-1920

Over the past two years, we’ve audited more than 2,000 AdWords accounts at Disruptive Advertising.

I’ve written at length elsewhere about what we learned from all of these audits, but in this article, I want to explain how you can use our conclusions to directly improve account performance.

To begin, let’s take a look at where most ad spend goes wrong. Then, I’ll show you how controlling wasted ad spend directly improves account performance. Lastly, I’ll explain how to use your own account data to access the full potential of your AdWords budget.

Ready? Let’s get started.

Where’s your budget really going?

Ideally, your AdWords budget should be buying you clicks that are likely to convert — that’s the point, right?

Since paid search advertising is intent-based marketing, your ads should show up for internet searches that indicate a strong purchase intent. In other words, you want to be seen when people are looking to buy what you have to sell.

The question is, how do you know if your ads are showing up for high-intent searches?

Well, it’s fairly easy: just look at your Search Terms report. The Search Term report lets you see exactly what searches triggered your ad and how many impressions, clicks and conversions each search term produced.

If your campaigns are running effectively, your ads should show up when people are searching for what you have to offer. As a result, when they click on your ad, they should be taken to a landing page that meets their needs and convert.

In concept, it sounds great. In practice, though, it rarely works out that smoothly.

Across thousands of AdWords accounts, we discovered that the median AdWords account wastes 76 percent of its budget on search terms that never convert. That means the average AdWords account is wasting 76 percent of its budget.

Now, to be fair, when a company spends more on AdWords, they do get more productive spend:

productive-vs-wasted-ad-spend

But, even looking at total ad spend across all accounts, 61 percent of ad spend is still wasted on the wrong search terms.

Fixing the problem

Fortunately, wasted ad spend is a very easy problem to fix. You control your keywords, which gives you control of your search terms. So, if a search term isn’t converting, you can stop paying for it!

After discovering how much ad spend is wasted, we made eliminating wasted ad spend a key part of how we manage our clients’ AdWords accounts. The results have been astonishing.

most-important-gif-ever

Check out the charts above. On the left, you can see how much is spent on each term and how many conversions that search term produces. On the right, you can see how that translates into total ad spend and total conversions.

As our clients stop wasting money on the wrong search terms, spend drops and conversions spike.

And the improvement isn’t linear… it’s exponential. In most cases, each 10-percent decrease in wasted ad spend (e.g., 70 percent to 60 percent) decreased the cost per conversion by 30 to 60 percent.

That’s each 10-percent decrease.

So, if you’re wasting 76 percent of your ad budget today, and you drop that number to 66 percent, your cost per conversion could drop by as much as 60 percent. And if you get your account down to 56 percent wasted ad spend, your cost per conversion could drop another 60 percent. And so on… and so on… and so on…

For example, as one client’s wasted ad spend dropped from 91 percent to 68 percent, their cost per conversion dropped from $160.38 to $38.58!

cpa-vs-wasted-spend

And it all happened in a matter of weeks.

“But Jake,” you might ask, “what about sales? It doesn’t mean much if all of those cheap conversions don’t turn into sales!”

Remember, this approach doesn’t actually change which terms we bid on, it just focuses the budget on what’s working. As a result, our clients simply got exponentially better results from their productive keywords and search terms.

And it showed in their sales numbers, as well. While not all of our clients report their exact sales numbers back to us, we regularly see results like 300 to 500 percent more sales or 25 to 65 percent lower costs per sale using this approach.

How to take control of your wasted ad spend

Now, at this point, you’re probably thinking…

how do I get that goodness in me?

Fortunately, tightening up your Search Terms report is fairly straightforward. It takes some time and commitment, but the results are well worth the effort.

Get your conversion tracking working

To begin with, you’ll want to make sure that you have great conversion tracking in place.

In our audits, we found that although 58 percent of AdWords accounts have some level of conversion tracking in place, only 29 percent actually track conversions effectively. It’s not enough to simply track form fills. You need to track every type of conversion that comes from your ads: phone calls, chat messages, purchases… everything!

This is actually a lot easier than it sounds; you just have to take the time to do it.

Hopefully, if you’re a Search Engine Land regular, this should already be done. However, if you know you’ve got holes in your tracking, now’s the time to take care of them. Stop, go get your tracking set up (For help, click here for AdWords and here for Google Analytics) and come back when you’re done.

do it, do it now

Pull your Search Terms report

Once you’ve got a few months of quality conversion data in your account, you can see where your budget is really going.

It’s important to run your analysis on at least a month (preferably three to six months) of data. On any given day, or even week, there can be a lot of variability in which search terms produce results, so you need to look at a large window of data to get a good feel for how things are working.

To see where your budget is going, open AdWords and go to the Keywords tab. Make sure your date range is set appropriately, and click on “Search Terms.” From there, you can see how much ad spend each search term consumed and how many impressions, clicks and conversions it generated.

This is helpful, but to see how much of your ad spend was wasted, you’ll need to click the Filter drop-down menu and “Create filter” for “Conversions < 1” as follows:

search-terms-report-example

Scroll down to the very bottom of your filtered list, and look at the “Total – all filtered search terms” row. The number in the “Cost” column is how much you spent on search terms that never produced a single conversion.

Divide that number by the total amount you spent on all search terms, multiply by 100 percent, and you’ve got your percentage of wasted ad spend.

Discard the waste

Now comes the fun part: fixing your account.

In my experience, the Search Terms report usually evokes one of two reactions:

1. “What in the world?”

For some accounts, the problems are so extensive that there seems to be little rhyme or reason to the Search Terms report. This is usually a sign of poor campaign structure.

If your Search Terms report leaves you wondering, “Why have I been paying for that query?” or “What does this search term have to do with my campaign?,” you probably need to consider rebuilding your account from the ground up.

i don't understand it

Create new, highly focused campaigns around the keywords and search terms that are working, and then let things run. This alone will improve your campaign performance, but you’ll want to run this same report again in a few months when your account is running properly.

2. “Well, that’s interesting.”

On the other hand, if your account is working decently, you should be able to use this report to identify a variety of specific problems.

For example, if no one is converting on a particular search term that seems highly relevant to your business, it may be time to revise your advertising strategy for that term. Maybe that term needs a dedicated ad or landing page. Maybe you just need to test different ad copy to find something that works. Maybe the term isn’t as relevant as you thought it was.

Alternatively, you may find search terms that seem to occur rarely, but they all share something in common. Together, they indicate a major flaw in your keyword strategy that needs to be fixed.

Regardless of the specifics, looking at where your ad spend is being wasted will give you a ton of insight into how to improve campaign performance.

What we shoot for

As a general rule, we usually shoot for < 40 percent wasted ad spend in the accounts that we manage. This keeps your budget highly productive, while giving you room to test out new keywords.

However, even getting your wasted ad spend down from 76 percent to 50 percent will have a profound effect on your campaign performance, so don’t despair if that < 40 percent mark seems unattainable.

Conclusion

Wasted ad spend is a huge indicator of the health of your AdWords account. Fortunately, wasted ad spend is also a metric that is almost entirely under your control.

So, if you need to cut cost-per-conversion and boost sales, take a hard look at your Search Terms report. This critical report offers the vital information you need to eliminate waste and dramatically improve campaign performance.

Try it out and let me know what happens!

The post From waste to win: watch how a simple change affects AdWords performance appeared first on Search Engine Land.


from SEO Rank Video Blog http://ift.tt/1RMN632
via IFTTT

Wednesday, March 30, 2016

New report from the Local Search Association on SMB advertiser churn

This report from the Local Search Association and Vendasta explores some of the triggers and potential variables behind SMB advertiser churn using new data from Vendasta.

The data come from more than 275,000 small business accounts, and Vendasta made its aggregate customer data available as a source for this report in an effort to help isolate and identify churn variables and potential triggers and causes.

Some of the findings are counterintuitive and may surprise you.  Visit Digital Marketing Depot to download “SMB Advertiser Churn: New Data For An Old Industry Problem”.

The post New report from the Local Search Association on SMB advertiser churn appeared first on Search Engine Land.


from SEO Rank Video Blog http://ift.tt/1UDwsqw
via IFTTT

SearchCap: Google AMP, knowledge graph & auto ads

searchcap-header-v2-scap

Below is what happened in search today, as reported on Search Engine Land and from other places across the web.

From Search Engine Land:

Recent Headlines From Marketing Land, Our Sister Site Dedicated To Internet Marketing:

Search News From Around The Web:

Industry

Local & Maps

Searching

SEO

SEM / Paid Search

The post SearchCap: Google AMP, knowledge graph & auto ads appeared first on Search Engine Land.


from SEO Rank Video Blog http://ift.tt/22PBTqx
via IFTTT

Google launches its giant mobile search ads for auto makers in the US

Google is launching its specialized mobile search ads for automotive manufacturers and dealers. First announced in beta last May, Model Automotive ads and Dealer Automotive ads are now available to eligible advertisers in the US.

Original equipment manufacturer (OEM) automotive advertisers can run Model Automotive ads are on searches for auto makes and models. The ads feature large-format images, performance details and links to the manufacturer’s website, nearby dealers and other information. google mobile search ads for automotive launch

Toyota and Ford are currently running the new ad formats for some models. Google says engagement rates on Model Automotive ads have shown to be 30 percent higher on average compared to standard text ads. “Across our core line of car models, we’ve seen a 45% increase in conversion events and a 30% decrease in CPA compared to standard text ads,” Dionne Colvin-Lovely, director of traditional and new media for Toyota Motor Sales, U.S.A., said in a statement.

The Dealer Automotive ads are available to franchise and authorized auto dealerships in the US. The ads include location, directions, and a click-to-call button for nearby dealerships and display at the top of mobile search results. The dealer ads also integrate with the Model Automotive ads, accessed from the “Dealers” tab in those ads.

google mobile dealer ads

Why these specialized mobile ad units for automotive? The search giant says that half of automotive searches on Google now occur on smartphones — up 51 percent from a year ago. Searches for pictures of cars and truck brands rose 37 percent year-over-year with 80 percent now occurring on mobile. And searches for “car dealerships near me” have doubled, also with 80 percent of these searches now happen on mobile.

The post Google launches its giant mobile search ads for auto makers in the US appeared first on Search Engine Land.


from SEO Rank Video Blog http://ift.tt/22OKKJ3
via IFTTT

How to Idiot Proof Your Ad Campaigns

Marketing promotion sucks when you treat people the same.

That goes for conversions, and it goes for advertising too.

But the minute things start to go awry, people start messing with their landing page headline or ad descriptions.

As if those tiny, miniscule elements are the primary reason traffic’s not comin’ or visits aren’t convertin’.

The best landing page, optimized 100% correctly, can’t make up for the wrong audience seeing that message.

Ad campaigns are already difficult. But the good news is that you don’t need to possess ninja PPC skillz.

Instead, here is a dead simple way you can isolate where problem areas might pop up and stop them dead in their tracks.

When ‘Best Practices’ are Good Enough

Commonly accepted best practices are a starting point. The tip of a metaphorical iceberg.

They get all the attention and ink online. But there’s a mountain below just waiting to sink your campaign.

On a GREAT day, landing pages convert around 10% of visitors (and those are the ‘uncommon’, special ones that vastly outperform all the rest). That means the majority of page visitors are doing, well, anything else besides converting.

Slapping on a different ad-description isn’t going to budge that number. It won’t change the fact that those people simply aren’t ready to buy. It might get you from 6-7%. Which is great!

But in a world where over 50% of all customers interactions follow a ‘multi-event, multi-channel’ journey that takes various touch points prior to converting, we should look beyond tactical ‘best practices’ to make sure the entire funnel aligns to deliver the best conversions for our buck.

Managing the growing complexity is a top priority for marketers, with most juggling anywhere from 5 – 31 separate tools to manage messaging in a multi-channel marketing environment.

This can be best illustrated with the help of Google’s Customer Journey to Online Purchase, which shows how a typical customer’s journey might look (including which channels influence which parts) for most industries. Yay visuals!

journey-to-online-purchase-google

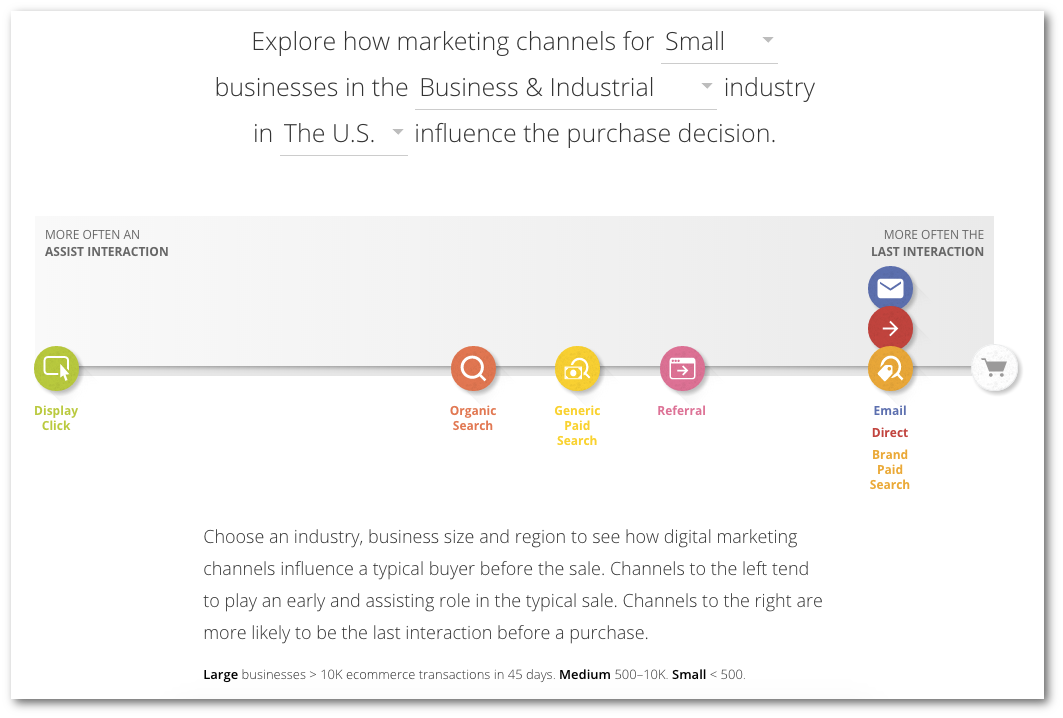
The point is, there are many things involved in a single conversion. Whether we’re talking about a product purchased or lead generated.

Unfortunately, ad campaigns today can’t be simple, static paths from New Visitor -> Conversion. Not in a world where it takes a minimum of 6-8 customer touch points prior to conversion. Or when your most profitable customers are NOT the ones who visit your site 1-3 times, but 14-20 before signing up.

Today’s ad campaigns are more like a delicate system of variables that depend on each other for success. (Enter your best ’synergistic’ MBA speak here.)

Making sure those things come together harmoniously is the best way to boost conversion rates for the long-term.

Here’s how.

1. Create Different Ad Campaigns for Each Customer Journey Stage

Ad campaigns should align with an appropriate stage of the sales funnel. Same as any inbound deliverable like an infographic, offline tradeshow, or other campaign.

You know, that whole Awareness, Consideration, Decision bit?

(If you have NO idea what I’m talking about, read about the buying cycle and triggers from David Skok. And then spend another 20 minutes reading everything else he writes – it’s worth it.)

buying-cycles-for-entrepreneurs

Ad channels (and even different campaigns on the same channel) can then be used for different purposes, whether that’s driving new sales to generating leads or simply boosting awareness. The opportunities are vast, but the execution needs to be precise.

ad-channels-sales-lead-awareness-distribution

Let’s start with generating initial awareness to see how this works.

Demand Generation

The goal here is to bring in new, targeted visitors. Obviously.

Problem? Nobody knows who you are. And frankly, they don’t really care. They haven’t yet become aware that they have a need for you yet.

So help them. Literally.

Start with their daily life. What issues pop up, take too long, or cause them frustration (that can also possibly tie back into your widgets)?

Listen:

Consumers ignore 86% of display ads. And those average banner ad click through rates are a dismal 0.1%. It ain’t easy out there.

Botching this jeopardizes everything else. So your value proposition needs to be awesome. Not good, or great. But, “Holy s$*% I need to [click this link / read this post] right now”.

Typical display ads, AdWords, and Facebook are well tread options. So let’s look at new, fresh examples like Twitter and Instagram. Less competition typically = less expensive = higher return on ad spend. And the principles are the same, regardless of channel.

For example, let’s say you’re trying to get the attention on Twitter. Instead of simply promoting your account (and making it all about you), solving a huge pain point or even providing a fun distraction can be enough to start introducing your brand to consumers.

verizon-twitter-ad-star-wars

The best social ads at this stage also ‘blend’ in with the content people are already consuming. You know, like that whole native advertising thing. For example, this one from I.D. Sarrieri is very Instagram-ish – selling a mood or theme featuring their products.

idsarrieri-instagram-ad

Find this one, and many more great Instagram ad examples here.

Last but certainly not least, is your headline.

The best headlines are a crystallized version of your value proposition, and they tap into some deeper primal motivation to grab maximum attention. Bnonn’s SHINE headline formula is a great way to get started, giving you the ‘essential’ ingredients like Specificity and Immediacy that are critical to getting people to take action.

You can also study the masters like BuzzFeed, who crank out brilliant headlines day-after-day that can be templated for re-using later. For example:

buzzfeed-headline-article

This one might look like:

  • # + [Perfect Adjective] + [Noun/Keyphrase Solution] + [To/For/Like] + [Fix Your Undesirable Thing]

Lead Generation

Once you’ve captured attention, the next step is to get them interested.

You do that by constructing a ‘bridge’ between their problems or pain points, and your widget which can ultimately solve those things for them.

One of the most popular techniques here is some kind of ‘lead magnet’ to generate a micro-conversion like a basic email address. Chances are, you’re familiar with all the usual suspects like eBooks, webinars, checklists, and more.

But ‘content’ based offers can mean much more.

For example, most designers are starved for stock photos, especially with the exorbitant costs at the well known sources.

Here, Bigstock is providing 35 free!

bigstock-free-photos-twitter-ad

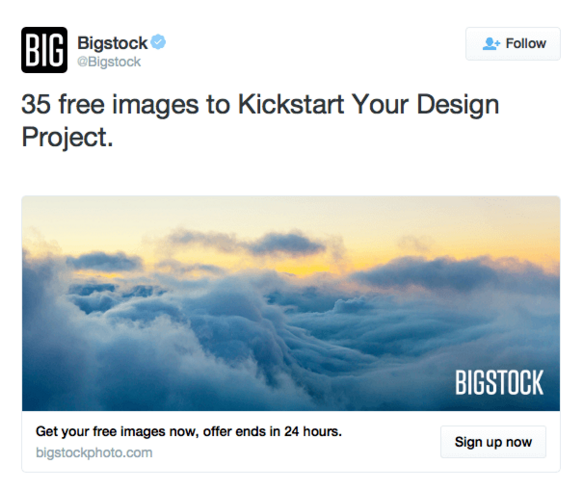
(Here are a few more Twitter ad examples to browse for inspiration.)

Even something as simple as a recipe could work wonders because it blends (pun intended) an offer to get attention with the products they’ll need (and can purchase from you).

Smirnoff’s example below is a perfect example of bridging the gap between those two worlds.

smirnoffus-instagram-ad

Closing Customers

By this point, prospects should know who you are and at least have some interest in your product.

Otherwise, we run into that original problem of trying to convert cold, unaware leads (which all of the best tactical practices in the world can’t help).

The key? Make them an offer they can’t refuse. Especially if switching costs are an issue.

For example, MailChimp executes brilliantly by running a competitive offer to Constant Contact peeps with a free three month offer. That should help soften the blow of having to move all email templates and contact records, while also giving those people enough time to settle in with the service.

mailchimp-3-months-free-twitter-ad

(The actual content and CTA looks a little sloppy, but the overall offer is great.)

Admittedly, selling on Instagram is a, well, tough sell. It’s still early days, and the channel is mostly known for brand awareness.

But still, the Cromwell in Las Vegas does as good a job as any, highlighting their attractive property in a multi-ad set with an appropriate CTA.

cromwellvegas-instagram

If you’ve done all the hard work up to this point (like getting awareness, building interest, and developing trust), the sales offer should be simple and straightforward.

A great offer or promotion can help, but shouldn’t be required to get people to open up their wallets.

But if it is still difficult or damn near impossible, this next section can help.

2. Pinpoint & Upgrade Underperforming Stages

Creating different ad campaigns for specific sales funnel stages can help illustrate potential gaps, making it easier to break down exactly where you’re excelling (or falling short).

That way instead of overreacting and making rash conclusions, you can start measuring those micro-conversions between stages or steps to find leading indicators of success.

For example, experiencing low sales but demand seems to be there? Insert more lead gen and nurturing campaigns into the mix to bridge that gap. The end result, should resemble a complete ‘customer journey’ that seamlessly moves people from one step to the next.

customer-journey-brand

But what if those things check out, and still nothing. You’ve got ad campaigns targeting each step, and they seem to be performing well. Except for that whole sales thing.

Break your ad campaigns down even further into the individual variables that dictate success.

Google AdWord’s Quality Score is kinda the gold standard for using algorithms to award and set pricing in an auction based ad system. Facebook has also been testing different algorithms that act similarly.

What’s unique, is that these algorithms use factors like ad relevancy from the ads you’re running, to the keyphrases or audiences, and even through the landing pages. They factor all of these details, and then create a holistic score that dictates (a) how often your ads show and (b) what you’re going to pay.

Algorithms like these force advertisers to consider how every single ad campaign element works together to produce the best ROI (instead of simply focusing on the single ad creative you’re working on).

So let’s start with the tactics, and work backwards to see if we can get any quick wins.

offer-to-landing-page-stages

Addressing or changing elements like the ad creative and landing page are far easier than ripping up the offer and starting from scratch. You can A/B test these elements according to commonly accepted best practices (which take all of 5 minutes Googling).

And it’s the easiest, ‘low hanging fruit’ to quickly improve your Quality Score (or similar relevancy scores in other social ad platforms) that deliver fast results.

If issues still persist, take another step back to address the audience you’re targeting (or keyphrases in AdWords which inherently have a certain type of audience searching). Chances are, improving audience targeting could give you that breakthrough.

For example, custom audiences on Facebook help you get more specific by targeting segments of past customers, retargeting website visits, or even the individual product page visited. Target saw a “20% increase in conversion [using Facebook’s Dynamic Product Ads] compared to other Facebook ads”, according to Senior Vice President Kristi Argyilan.

Assuming your offer or value proposition is sound and that the channel is appropriate, iterating on the audience, ad creative, and landing pages should deliver something at the end of the day.

Otherwise, you have bigger issues (beyond advertising) that are holding you back.

Conclusion

The tactical best practices you read about all over the interwebs are important.

But only to a point.

Breaking things down by sales funnel stages can help you determine where you’re excelling or falling short in key categories. They alert you to gaps in the customer journey that can cause breakdowns in driving new sales.

Once that’s completed, you can get even more granular by looking at each independent variable within a single ad campaign to see where further bottlenecks are choking results. Working backwards from the ad creative and landing pages to your audience will give your campaigns a quick lift (assuming your offer or value proposition + channel selection check out).

Big conversion increases don’t happen overnight by swapping out your headline or button color. They come from iterating on these tiny details along the way, making small improvements at each little step.

And best of all, isolating different variables helps assign priority, keeping execution focused and simple in an increasingly complex world.

About the Author: Brad Smith is a founding partner at Codeless Interactive, a digital agency specializing in creating personalized customer experiences. Brad’s blog also features more marketing thoughts, opinions and the occasional insight.

International PPC: How to deal with currency fluctuations

globe-world-spending-money-currency-ss-1920

One issue I’ve seen with international PPC is how to keep track of your spend and ROI abroad compared to at home. When setting up billing, you can either choose to use the target market currency or use your home currency. There are pros and cons to both, though I don’t intend to discuss them too much here, as most advertisers would have already made a decision a long time ago.

What is critical is that regardless of the currency you select, Google’s (and maybe Bing’s) internal auction is converted to USD in order for AdRank to be calculated. So without actually changing your bids abroad, you are bidding more and less aggressively based on currency fluctuations and competitor currencies.

Below, I’ll share a dashboard that we use for international PPC clients at Brainlabs (my employer) to track these movements and make adjustments where necessary.

This Google Sheets dashboard has all the currency information you will ever need to take back to your PPC reporting. Use this sheet to help keep currency conversions simple and up-to-date. There’s a brief explanation of how it works at the end of the article, along with a bit of code for those of you who want to convert currencies in JavaScript.

There are many reasons you may need currency data. Here are a few we thought of:

1. Improve your analysis and compare performance across markets

When analyzing your business across markets, it’s difficult to compare cost-related metrics unless everything is the same currency.

You might also want to check out the volatility of a currency before moving into a new market, especially if you’re going to need to convert money to make payments — if the exchange rate changes by 10 percent over the course of a month, you may end up paying much more at the end of the month than you would have at the start.

2. Use for reporting and billing

Like many of our clients, you may do the majority of your business in the country in which you’re based but have branched out to do some international business, too. Whether your operations are digital or otherwise, it’s usually preferable to have these international ventures use the local currency. For AdWords, this means setting up a different account in a different currency and getting billed for it at the end of the month in this currency.

It also makes reporting a bit of a nightmare — if you’re advertising in the US, Canada, Mexico, the Bahamas and Bermuda, you have to manually look up the exchange rate for each of these each day just to know how much you’re spending. Using a currency conversion function makes this automatic, keeping the exchange rate current, so that you always know your total spend in US dollars.

3. Bespoke paid-for currency conversion software can be expensive

Currency conversion software can cost anything from $5 to $1,000 a month, depending on how heavy your usage is, how frequently you want rates to update and how flexible you want to be with the currencies you use. In general, the more recent and accurate you want your data to be, the more you are going to pay.

Back in 2011, Google had its own finance service that retrieved exchange rates (and other financial data) for free, making it easy to perform currency conversions in scripts. The service itself has now been deprecated, but a method to access this data lives on through the GOOGLEFINANCE function in Google Sheets.

The Brainlabs Currency Converter

Now to the Brainlabs Currency Converter dashboard.

Brainlabs Currency Converter

To use it, click on the File menu, and then “Make a copy….” Save the copy to your Google Drive, and then it’s ready to use.

The sheet has four pages:

  • The Current Exchange Rate sheet. This is a table of the current exchange rates between various currencies, updated by Google every three to 20 minutes. Feel free to add in any currencies you are interested in; you can look up their three-letter currency code here. If for some reason it’s not providing you with the exchange rate, it could be that GOOGLEFINANCE doesn’t support exchange rates for that currency.
  • The Detailed Exchange Breakdown sheet. This is for looking more deeply into the exchange rate trends — how much has it changed over the last month? Over the last year? After choosing a lookback window, it gives you the exchange rates at close for each day, as well as graphing them and giving you the highest, lowest and average values in that time. If you want this detailed breakdown for several different currencies at once, you can duplicate the sheet and have a different conversion on each copy. To use, just enter a lookback window in days in cell B1 (or custom start and end dates in cells B2 and B3), then the three-letter code for the currency you’re converting FROM in B4, and TO in B5.
  • The Exchange Rate To Single Currency sheet. This sheet gives you a slightly less detailed look at the exchange rate to a single currency. Alter any of the red boxes to get exchange rates from many different currencies to just one, with the current exchange rate alongside the average, maximum and minimum exchange rates for a given time period.
  • The Useful Date Formulae sheet. A little bonus — this sheet contains some formulae for date periods you may want to use in the detailed exchange breakdown. These correspond to some of the date windows used in AdWords — useful if you’re in SEM and are using it to convert currencies.

If you’re more technically inclined and would like to implement currency conversion in code, here’s a JavaScript template to get you started:

The post International PPC: How to deal with currency fluctuations appeared first on Search Engine Land.


from SEO Rank Video Blog http://ift.tt/1RKMFD4
via IFTTT

A century of celebrating Mom: smart ad strategies for the mother of all holidays

mothers-day-gift-ss-1920

In 1914, Woodrow Wilson signed a bill recognizing Mother’s Day as a national holiday. A century later, the holiday has become much more than a celebration of more than 85.4 million mothers. Mother’s Day is now the third-largest retail holiday in the US, with total spending at $21.2 billion, according to the National Retail Federation (NRF).

No one likes to skimp on Mom. The NRF reports that the average shopper plans to spend $173 on their mother this year, with gifts ranging from consumer electronics to jewelry to flowers. And a new favorite gift is on the rise: the gift card. The NRF estimates that 44.2 percent of shoppers plan to buy Mom a gift card, with total spending expected to reach $2.2 billion.

How do you make sure your ad campaigns are working as hard as possible for you this Mother’s Day? Here are Bing Ads’ top tips for Mother’s Day success.

Timing is everything

Mother’s Day searchers begin a month in advance and are most active the week prior to the holiday — particularly those in search of flowers, gifts and greeting cards (Microsoft internal data, 2015).

SEL Bing Ads Mothers Day 1 SEL Bing Ads Mothers Day 2

Make it mobile

Mobile searches continue to grow; last year, within the Bing Network, Mother’s Day mobile searches saw a 39-percent increase. This year, smartphones are expected to play an even bigger part in Mother’s Day shopping. According to the Retail Insight Center‘s Mother’s Day Overview, here’s how they will be used:

  • Researching or comparing prices (43 percent)
  • Purchasing gifts (28 percent)
  • Looking up retailer location, store hours, directions and so on (25 percent)
  • Using apps to research or purchase gifts (16 percent)

Pay attention to click-through rate (CTR) by category

Click-through rates and volumes trend by gift category, so make sure to identify when CTR is high and cost-per-click is low for your category so you can capitalize on this opportunity.

mothers-day-bing-cpc-ctr

Choose words that work

A recent Microsoft Internal Data study (April 1, 2015–May 15, 2015) shows that specific word combinations make a big difference during Mother’s Day campaigns. For instance, a Flowers/Cards/Gifts/Candy ad highlighting “Online” in the title and “Cards” in the description has high ad quality.

mothers-day-bing-keywords

[Click to enlarge]

If your category is Flowers, top-performing ads should include the words Online (“online,” “official site,” “order online”) and Gifts (“apparel,” “bags,” “baskets”). For mobile devices, use % Off (“%” or “save %”) in the ad title, combined with Online in the ad description.

For Cards, include the words Delivery and Shipping (e.g., “day delivery,” “fast delivery,” “free shipping”). On mobile devices, Price/Pricing (“cash,” “affordable,” “price”) works best in the ad title when paired with Cards (“gift cards,” “cards,” “postcards”) in the description.

Align your Gifts category ad copy to what your audience is searching for by using Brand terms in the ad title and using Dynamic Keyword Insertion in the ad description.

For the Candy category, Brand names rule once again when it comes to driving performance in the ad title. For PC, combine Gifts in your ad descriptions with Free; for mobile, use Flavor (e.g., “vanilla”) in your ad titles.

And finally, the Jewelry category ad copy performs best when there are Style/Type details in the ad title (e.g., “unique,” “colors,” “styles”). Pair this with a Call to Action (“buy,” “order now,” “get free”) to increase ad quality. For mobile devices, make sure you use a Call to Action in the ad title to boost ad quality.

SEL Bing Ads Mothers Day 5

Product ads: a compelling picture

Use high-quality images. Use images with a white background to make them pop. Do not include any text within your images (e.g., promo messaging for free shipping). Test different images of the same product to determine which image performs best

Put as many relevant keywords in the product title and description as possible. Also important, add negative keywords to prevent ads from showing on items you do not offer. Test multiple promotional text options to determine which one is resonating most, and then apply larger bids to best-sellers.

Make sure you optimize your data feed for Mother’s Day, and validate your data. It pays to ensure your product feed is properly formatted.

Product discoverability is of the utmost importance. Use the SKU column and unique identifiers to help differentiate product titles and descriptions that may only differ in size or color. Make sure all unique identifiers are consistent between data feeds, and use descriptive titles with all the relevant information as possible. Go beyond the required attributes and populate your feed with as many recommended attributes as possible for each product offer.  The more information you make available in your title, the more likely your product ads will be shown for relevant searches.

Create at least one campaign that targets all products in the feed. This will help you gain insights about products that may deserve attention but are not currently captured by other product groups. Target specific products in your feed beyond “all-inclusive,” and include specific brands, product types or individual products that align with your business goals

Create custom labels that can help you group your products and target more successfully. For instance, labels can be created specifically for high-margin products, items with low or high return on ad spend and so on.

And, last but not least, given that Mother’s Day is a very short seasonal event, refresh your feed daily.

Happy moms, happy customers

Remember, Mother’s Day is a big retail holiday, one that warrants a solid strategy.

So plan accordingly, and start your campaign planning early. Depending on what you sell, consider timing for your ads, your device strategy and word combinations, and include enough information to make sure your Product Ads are shown.

After all, when Mama is happy, your customers will be, too.

For a closer look at these insights and more, check out Mother’s Day Insights for Digital Marketers from Bing Ads:

The post A century of celebrating Mom: smart ad strategies for the mother of all holidays appeared first on Search Engine Land.


from SEO Rank Video Blog http://ift.tt/1PFznqb
via IFTTT

Google Adds Share Feature To Knowledge Graph Panel

google-fact-answer-knowledge-ss-1920

Now when Google shows a knowledge graph panel for a search query, the knowledge panel contains a share icon which let’s searchers share the search results on Facebook, Twitter, Google+, through email or with a short link. The share icon is situated on the left of the logo in the right side knowledge panel.

Here is a picture of how it looks:

google-knowledge-graph-new-1459339474

When you click on it, it pops open this sharing box, giving you the option to share the search page on Facebook, Twitter, Google+, through email or with a short link. Here is a picture:

share-google-knowledge-graph-1459339664

Hat tip to @AaronFriedman.

The post Google Adds Share Feature To Knowledge Graph Panel appeared first on Search Engine Land.


from SEO Rank Video Blog http://ift.tt/1q1FccZ
via IFTTT

Google AMP Listings Feature Live In 12 Countries

google-amp-speed-race-fast-ss-1920

On February 23rd, Google began showing AMP listings in the mobile search results but it only rolled out to select regions.

A month later, Google has only rolled out the AMP based news carousel in 12 different countries. Elena L. from Google listed the countries where you can find AMP powered news in a help thread, they include:

  • United States
  • Brazil
  • Germany
  • Spain
  • France
  • United Kingdom
  • India
  • Indonesia
  • Italy
  • Mexico
  • Japan
  • Russia

There is no word on when it will expand to other regions or beyond the news carousel.

To learn more about AMP, see our Google AMP project category.

The post Google AMP Listings Feature Live In 12 Countries appeared first on Search Engine Land.


from SEO Rank Video Blog http://ift.tt/1pKhCAM
via IFTTT