“The grocery-delivery firm’s ad revenue totaled about $740 million last year, up 30% from 2021, according to a person familiar with the matter. That’s a striking increase, given that the digital ad market was largely stagnant last year. Nearly 30% of Instacart’s 2022 revenue came from selling advertising rather than actually delivering groceries.”
Ads accounted for about 20% of Instacart’s $1.5 annual revenue in 2021 – about $300 million – according to a June 2021 Insider report.
For comparison. Advertising accounted for about 10% of Amazon’s revenue in 2022, according to The Information. Meanwhile, Amazon made $37.7 billion in revenue through advertising last year.
Why we care. Instacart remains a viable alternative for brands to promote products directly to consumers. And the company has updated its platform to attract more advertisers.
The bigger picture. In 2022, Google and Meta’s advertising market share dropped below 50%. This trend is expected to continue in 2023, in part, due to the rise of emerging ad platforms like Instacart.
The rise of retail media networks. Retail media search spend is forecast to be near $30 billion this year – and RMN digital ad revenue is expected to hit $45 billion. Dig deeper in U.S. paid search spend forecast to hit $110 billion in 2023.
Non-skippable ads are coming to YouTube Select on connected TV. This means that viewers will see one 30-second ad instead of two consecutive 15-second ads.
Why we care. YouTube was the most popular U.S. video streaming platform in April and watch time increased, according to Nielsen. It remains to be seen whether a non-skippable 30-second format provides a good advertising ROI.
What YouTube said. YouTube explained in a blog post:
“We know that running longer-form creative on the big screen aligns with your objectives, and allows for richer storytelling. YouTube Select is now landing over 70% of impressions on the TV screen, so we’re making it easier for you to use existing assets in front of the most-streamed content.”
YouTube Select is the top 5% of the most-viewed and most-engaging content.
U.S. first. YouTube’s new ad type will initially be available only in the U.S., with plans to expand availability internationally later this year.
Pause Ads. YouTube also announced it will be testing “Pause experiences” on CTV. This experimental feature will allow viewers to pause videos, to potentially help drive awareness or an action – perhaps via a QR code.
ChatGPT is now available as an iOS app. The app is free and offers all the features you’ll find on the web version.
Why we care. ChatGPT has become an essential and popular tool for several SEOs, search marketers and content creators. Now you can use it whenever and wherever you want, all while maintaining your history. Plus, the app interface seems a bit more user-friendly than using ChatGPT on a mobile browser.
Plus. You’ll need to subscribe to ChatGPT Plus to get access to its GPT-4 model, as well as the other Plus features.
Voice input. The app also uses OpenAI’s speech-recognition system, called Whisper, to enable voice input. Early reports indicated this feature to be a bit buggy.
U.S. only for now. The app will roll out to U.S. users first, then expand to more countries in the coming weeks.
ChatGPT on Android “soon.” OpenAI said an app is coming soon for Android users.
Keyword difficulty isn’t one of SEO’s hottest topics or latest trends. But it is a powerful metric when you understand its potential.
It can help you to make educated decisions about your prospects of ranking for specific terms, allowing you to make tactical choices that underpin your SEO strategy.
Here’s what keyword difficulty means for SEO, how the score is measured and tips for using it to get better results.
What is keyword difficulty?
Keyword difficulty is a metric that quantifies how competitive a keyword is and, therefore, how challenging it’s likely to be to rank for it. It is displayed as a value from 1 (low competition) to 100 (extremely high competition).
What does the score tell you?
Keyword difficulty in SEO tells you how difficult it’s likely to be to rank for a particular keyword in relation to the strength of the competition. However, there’s no standard for calculating the difficulty or competition to rank for a particular keyword.
Various tools measure it differently, and scores can vary significantly based on which one you use.
Most tools factor the strength and number of referring domains pointing to the top ranking results in the search engines into their calculation, but many use additional metrics too.
Where do you find it?
There are a variety of different SEO tools that provide a keyword difficulty checker.
It is usually found in the keyword research function of a tool and displayed alongside the search volume metric, labeled difficulty, competition or KD.
Tools to check keyword difficulty
To check the competition for keywords at scale, you will likely need a paid keyword research tool. Here are some of the most well-known:
Ahrefs
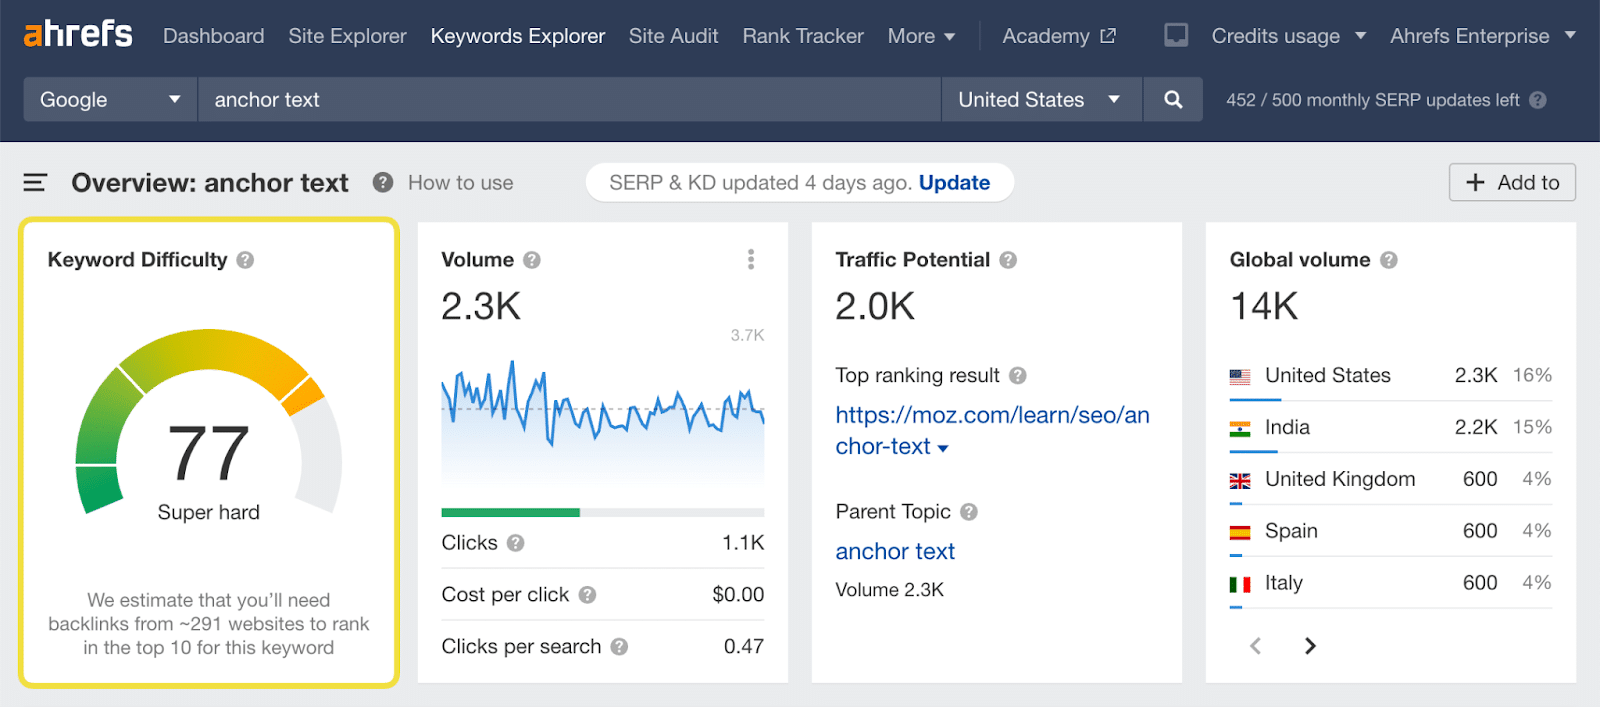
Navigate to Keywords Explorer and you can begin your search. The difficulty score is clearly labeled and color-coded along with descriptive text to help you understand the difficulty level.
“Here at Ahrefs, we use a simple method for calculating KD. We pull the top 10 ranking pages for your keyword and look up how many websites link to each of them. The more links the top-ranking pages for your keyword have, the higher its KD score. Very simple and very actionable.”
Semrush
In the Keyword Overview section of Semrush, you’ll find their difficulty metrics. There’s also a KD column in keyword reports.
How is it calculated?
Semrush uses SERP analysis, keyword analysis and a score weighting based on locality. You can read the full details here.
Moz
The keyword explorer in Moz gives you an immediate score that’s easy to find and interpret.
“Keyword Difficulty in Keyword Explorer takes into account the Page Authority (PA) and Domain Authority (DA) scores of the results ranking on the first page of Google for the given query, as well as modifying intelligently for projected click-through rate (CTR) of a given page. Keyword Difficulty puts more weight on higher-ranking, more visible pages, and less weight on lower-ranking, less visible pages. The formula also accounts for newer pages on powerful domains that may have DA scores but have not yet been assigned PA values. The scores roughly correspond to a weighted average of the PA of the top 10, and the other inputs (DA, homepages, query term use, etc.) modify that weighted average.”
Sistrix
Head to Keywords in the top navigation to reach the keyword explorer.
Enter a seed term or a list of terms. You’ll reach an overview page if you use a seed term, and the difficulty score is displayed for that specific term.
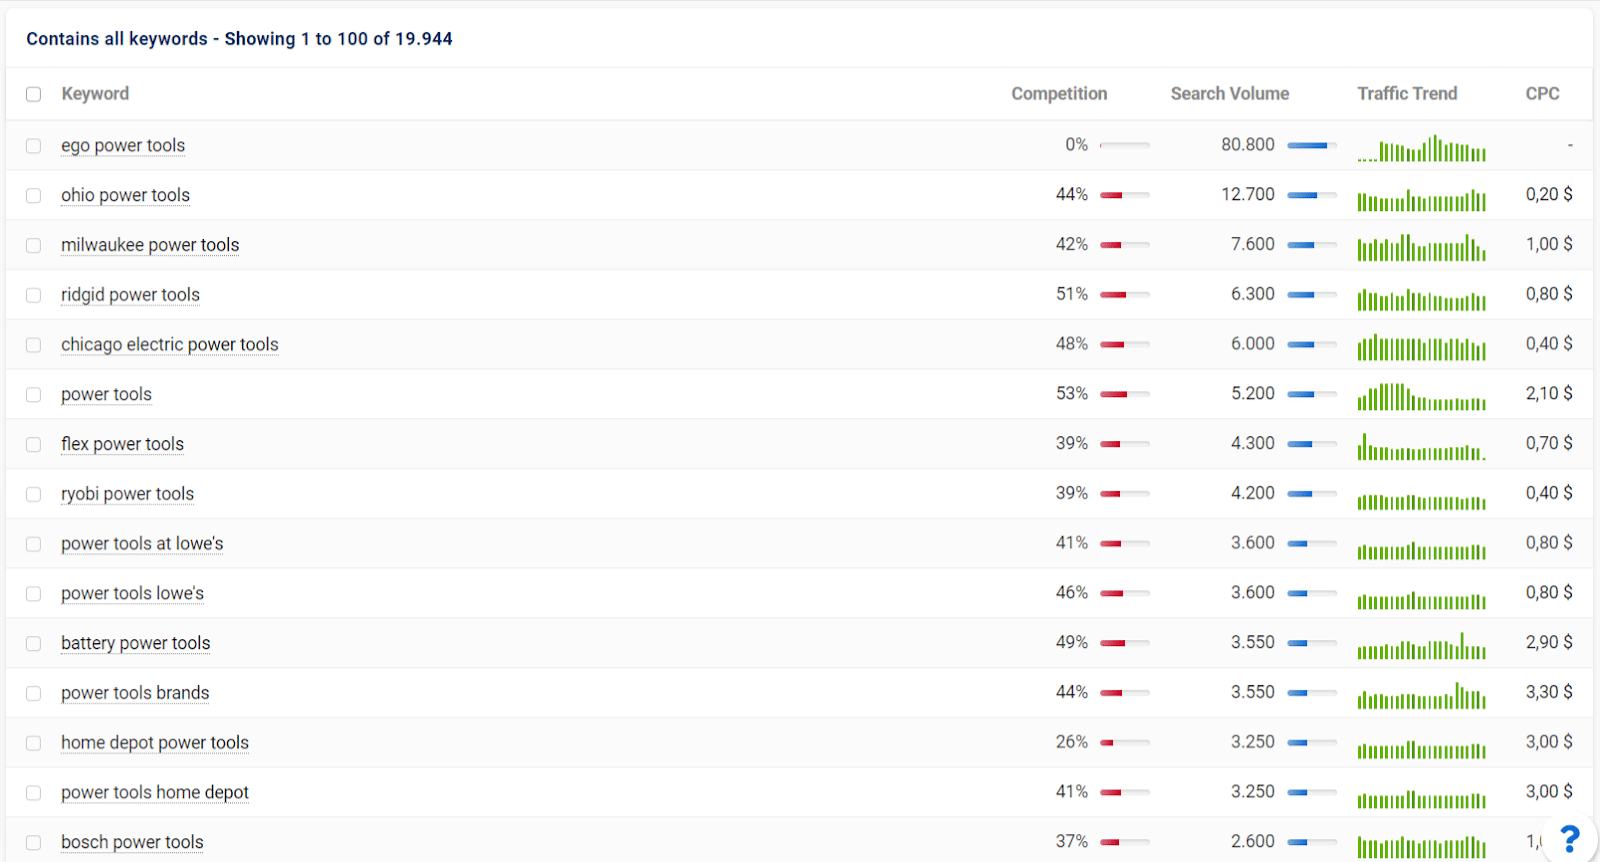
Drill down into a keyword list under Contains all keywords to reach a table with competition and keyword difficulty.
How is it calculated?
Sistrix states they use “a number of values” to calculate their difficulty score. They go on to say:
“Around 15 values for each keyword are regularly analysed and summarised in this key figure. These are quite intuitive metrics such as the number of searches, but also more complex observations such as the number of start pages (not sub-pages) in the top 10.
The value has a logarithmic structure. In practice, this means that an increase in the competition key figure by 10 points represents roughly twice as intense competition in the SERPs for this keyword.”
As you might expect, each tool is tight-lipped on what exactly goes into its calculation. Each approach is quite different, which explains the varying scores.
Quick tip: Pick a tool for each project and stick to it. Don’t mix data from different tools, as you won’t be comparing like-for-like when it comes to keyword difficulty.
Get the daily newsletter search marketers rely on.
Keyword difficulty in itself is neither good nor bad. It’s simply information.
OK, if you have a brand new site to launch with a small budget and all the keywords that are relevant to you have extremely high competition, that's bad. But that’s also pretty lousy business planning.
Having an understanding of keyword competitiveness is undoubtedly good. Appreciating how it can work for you gives you a head start on the competition.
What is high/low keyword difficulty?
In general terms, a high-difficulty keyword has a lot of competition, making it more challenging to rank highly in the organic search results.
You’ll likely find some brand names you recognize ranking for high-difficulty terms.
For example, let’s take the keyword “iphone 14.” Sistrix gives it a competition score of 67% in the U.S.:
The SERPs look like this:
Up against Apple, CNN and Wikipedia, we can see that ranking in the top 10 would be a challenge for smaller brands.
Broadly speaking, low difficulty means that the competition isn’t as fierce. You might find less relevant results and may spot some niche websites that aren’t household names.
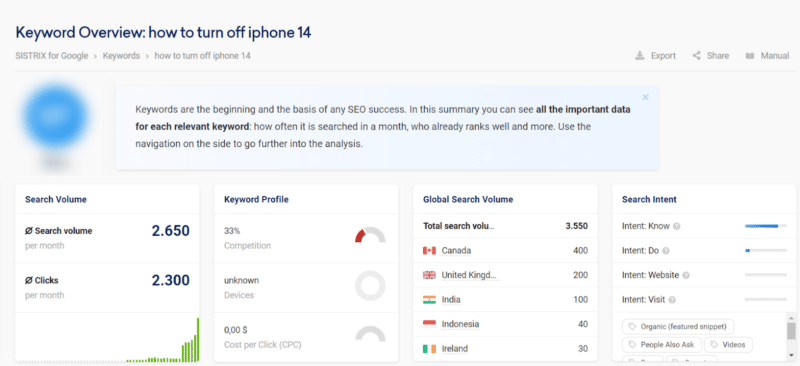
Now let’s switch that earlier example to a term with much lower difficulty “how to turn off iphone 14.”
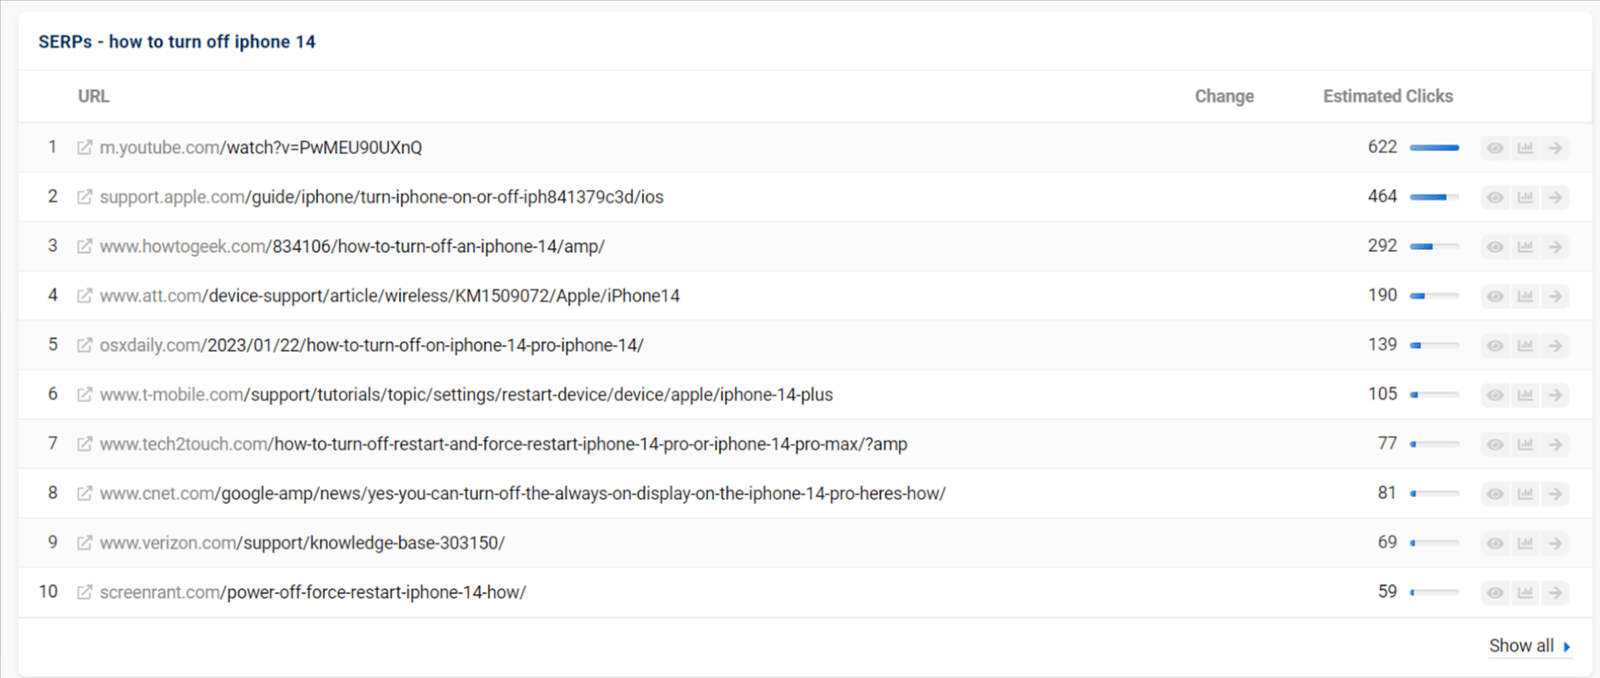
The competition level is just 33%. You’re still up against some big names, but you can also see some in there that you might not recognize.
This shows that if you create some really useful and relevant content, you might have a shot at ranking fairly well.
When you’re looking at keyword competition, everything is relative.
This is why I love using color scales to review a keyword list. It helps to visualize the highs and lows in relation to the dataset you're working from.
Once you’ve drawn up a list of keywords you're interested in for a new page or piece of content, you can look at the difficulty spread across the whole list.
What is a good keyword difficulty?
This is where things get tricky. A “good” keyword difficulty is a sweet spot relative to all the other considerations you have to make.
The best approach is to gather all the relevant information, including competition scores, and use this all to make strategic decisions.
It’s no easy task, but the more frequently you do it, the more you learn.
Factors to consider when looking for a good keyword
There are various considerations to make when assessing a keyword’s viability. It’s a balance between the following:
Search volume.
Your site’s current strength in the market.
The strength of your backlink profile.
How competitive a term is in relation to other terms you could target (difficulty).
How well your content can fulfill search intent.
You’ll come to your decisions by weighing up these factors.
How do I choose keyword difficulty?
When you’re reviewing difficulty scores, it’s not a case of choosing a number or a specific difficulty level. It’s simply a useful metric to help you understand the playing field.
Difficulty scores are a small but important part of choosing keywords for SEO. My process is as follows:
Enter my seed keyword into an SEO tool that provides search volume and keyword competition or difficulty metrics.
Select all the relevant keyword options and save them in a list.
Export the list to Google Sheets or Excel.
Sort by search volume (highest first).
Format the search volume and keyword difficulty columns with color scales.
Use the color scales as visual clues to spot keywords with high(er) search volumes and low(er) difficulty scores.
Pick out one or two primary and a handful of secondary keywords you’re most interested in.
Review the search intent for this refined list, look at what currently ranks and be honest with yourself about whether you plan to create a page that will fulfill that search intent.
Remove any keywords from your refined list that don’t line up with search intent.
Always keep the domain you’re working on in mind. If you’re a big brand with a high authority site, you might not need to be as concerned with keyword competition as a small to medium-sized business that needs to seize every opportunity to gain ground in the SERPs.
You should be left with a qualified list of target keywords to help you focus your content.
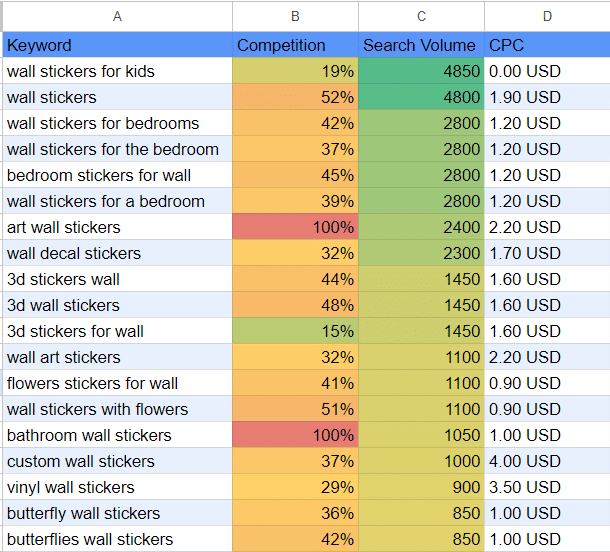
Here's an example of how I use color scales to visualize the opportunities:
Here, “wall stickers for kids” looks like an interesting opportunity with a relatively high search volume (for my current dataset) and relatively low difficulty.
Without keyword research, I might have assumed that “wall stickers” was the obvious term to go after, but it's much more competitive and has a slightly lower search volume.
So assuming my range is for kids, I’ve found a possible target keyword here.
But… are keywords still important for SEO?
There's a much higher focus on AI, machine learning, natural language processing and voice search today, and even Google Analytics has hidden a lot of its keyword data (not provided).
So you’re probably wondering why it’s even worth all this time and effort considering a keyword difficulty score.
Yet, keywords are still vitally important. This type of research gives you insight into what your target market is looking for and how they search for it.
This can be interesting, surprising and even amusing at times! There’s no filter when we search as we have a level of anonymity that allows direct and honest questions to be asked.
It also informs you about what your competition views as important and how you might be able to outsmart them or spot an opportunity they haven’t.
Keyword research can help you uncover new opportunities for products, product ranges or content.
Without regularly checking what people are searching for, you could miss out on new trends that initially have lower difficulty because the competition hasn't caught up yet.
How you create good, helpful and authoritative content to satisfy these queries is a different question, but understanding your marketplace in the SERPs is a step you should never miss.
A focused keyword list helps you keep your eye on the opportunities and forms the backbone of your overall strategy.
How to find low-difficulty keywords
You can filter or sort any dataset by keyword difficulty to find low-competition keywords.
But if you want to begin your search by looking for keywords that are easier to rank for, here are a few methods you could also try:
Adding search qualifiers
Refine your broad search by adding qualifiers. You can add words like “for,” “to” and “vs” to narrow down the options. You’ll get some more specific phrases, and usually, the difficulty score will be lower.
Looking for the long tail
By their nature, long-tail queries tend to be more detailed, specific and lower competition.
Because their search volumes are lower, there’s usually some low-hanging fruit for long-tail keywords.
Getting ahead of trends
Using tools like Google Trends, Pinterest Trends, TikTok Trends and Exploding Topics, look out for new areas of interest in your niche.
If you identify these early enough, the competition will likely be lower. There’s always a gamble here, though.
You can never be sure which trends will stick or how quickly the competition will catch on, potentially displacing your position in the SERPs.
Why is keyword difficulty important?
There are so many reasons keyword difficulty is an essential metric in SEO:
It’s strategic
Keyword difficulty is really important because it allows us to think strategically. As time-poor SEOs, we want to make the biggest impact with our work.
Understanding the competition in the SERPs quickly and efficiently provides a huge help with that.
It helps us make decisions – lots of them
We can evaluate whether to spend a lot or a little effort on new content based on the level of competition.
We can decide not to use any resources on trying to rank highly for certain keywords and gain recognition for highly competitive product ranges by other means like PPC, email or other forms of advertising.
We can choose whether to focus our efforts on-page or off-page.
It helps us to be smarter with our limited resources
When used as part of our strategy, keyword difficulty helps us to work smarter, not harder.
It’s a metric that helps us narrow down large amounts of data quickly and understand our opportunities quickly.
It can help you manage expectations
Sharing this metric with stakeholders can also help you to communicate more effectively.
Having something quantifiable that demonstrates you’ll have to work harder or allocate more resources can help you secure the provision you need.
Discussing this measure upfront can aid understanding, helping managers or business owners visualize why ranking for certain keywords is more challenging and might take longer.
Managing keyword competition in your SEO campaigns
While I’m a huge advocate for collecting and reviewing keyword difficulty metrics, it’s also important not to get too hung up on them.
As we’ve seen, each tool measures this notion in a different way. Keyword competition is more of a concept than an exact science.
I like to see this data as a signpost, not an instruction.
It’s there to help us make informed decisions at scale. You can read the signs and still choose to take a different turn.
For example, if something looks too difficult, but it’s a key part of your product range or service provision, go for it anyway.
It might just take a little longer to get to the place you’d like to be, but at least you’ll know what to expect.
So, how do you create content your audience will read (and not just skim)?
Make it more readable.
This sounds so simple it’s silly, but it’s true.
Readability is a giant factor that will determine everything from who engages with your content, how much value they get from it, and whether they’ll return to read more.
So, what is content readability, how is it measured, and how can you make your content easier to read?
It’s all inside this guide.
What is content readability?
Content readability measures how easy your content is to read for your audience.
Readable content is clear, easy to understand, and easy to skim.
On the other hand, content that’s hard to read is hard to understand, hard to skim, and unclear.
But perhaps the major difference between readable and unreadable content lies in how much value your reader can take away from each one.
Readable content effectively conveys information so your reader learns something new, makes a discovery, or solves a problem.
Unreadable content fails to do all of this – your reader can’t learn anything from it because the words and sentences themselves fail to make sense.
How do you measure content readability?
Content readability is both objective and subjective. It’s based on an individual’s reading level and intelligence, but it’s also measurable based on objective things like:
The word choices and vocabulary you use in your content.
How often you use common and uncommon words.
The structure and length of your sentences and paragraphs.
Many readability tests exist that measure your content in terms of the above factors and give you a score that tells you how readable your content is.
Here are the most common (and current, as in they were created or updated within the last 50 years) readability tests:
Flesch-Kinkaid Grade Level Formula
Flesch-Kinkaid is perhaps the most well-known readability formula. It looks at the ratio of words to sentences and syllables to words to measure the readability of your text.
This formula grades your content based on the lowest U.S. grade level that could easily read and understand it.
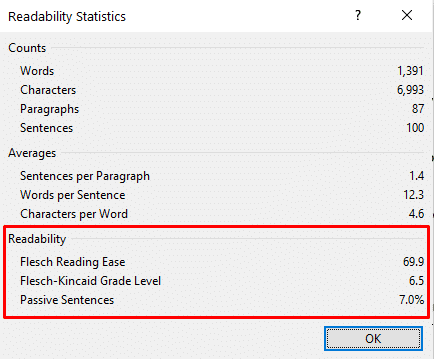
So, for instance, scoring a 6 means people who read at a 6th-grade level and above should be able to read your text easily. (By the way, this is a good score to aim for with online writing.)
Tools that can check your content against this formula include Microsoft Word, Hemingway Editor, Readable, and ProWritingAid.
In Microsoft Word, the readability statistics appear after you run a spelling and grammar check:
Lexile Framework for Reading
Another well-known readability measurement system primarily used in schools is the Lexile Framework. It has two parts:
Measuring text based on word frequency and average sentence length.
Measuring a person’s reading level.
For instance, content that’s harder to read (with a lot of long sentences and words that appear infrequently) will get a higher Lexile score. Content that’s easier to read (with short sentences and frequent words) will get a lower score.
Get the daily newsletter search marketers rely on.
But let’s say you’ve tested your content against a few readability checkers and discovered that it’s mostly hard to read.
What now?
It’s time to improve your content to make it more readable. Here are nine tips that will help.
1. Shorten your sentences
Shorter sentences are simpler. That’s why they’re easy to read.
Meanwhile, longer sentences tend to contain more than one thought or idea. Stuff your sentences full of information, and your readers will have difficulty untangling it all.
For this reason, shorten those sentences. And if you tend to write long sentences naturally, comb through your draft, look for them, and break them into smaller chunks.
Hot tip: A tool like Hemingway Editor automatically highlights long sentences so you don’t have to hunt for them.
2. Break up and shorten your paragraphs
While you’re shortening your sentences, go ahead and shorten those paragraphs, too.
At most, your paragraphs for written online content should contain no more than 1-3 sentences.
A big, dense paragraph with long sentences is daunting. It’s great for a paperback novel but terrible for your blog.
Nothing spells death to your reader’s attention span worse than a wall of dense text.
A good rule of thumb for breaking up paragraphs: One paragraph = one thought or idea. As soon as you move on to your next thought, move on to a new paragraph.
Remember: The “enter” (or "return") key is your friend.
3. Use active voice
Next readability tip: Write in active voice.
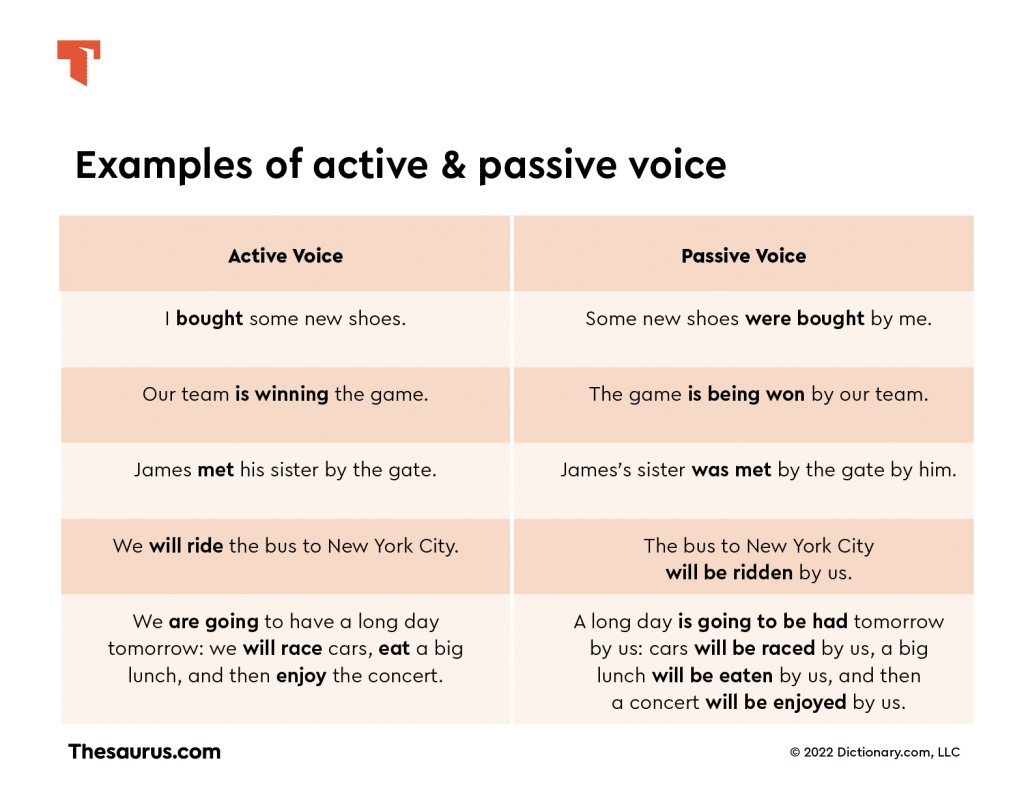
Active voice refers to how you word a sentence. When you word it actively, you clearly state the subject and verb.
Example: “The dog ran after the ball.”
Dog = subject. Ran = verb.
Passive voice means you’re wording a sentence passively. This means the subject of the sentence is unclear.
Example: “The ball was run after by the dog.”
See how the subject, the dog, is buried at the end of the sentence?
That said, sometimes passive voice works if you need to emphasize the action of the sentence vs. the subject.
For example, let’s say I wanted to tell you about a car robbery I experienced. I would say, “My car was broken into last night.”
The subject of the sentence (the person who robbed my car) is irrelevant – I don’t know who they are. What’s important to convey is that the robbery – the action – happened.
However, tread carefully. In most cases, active voice is much clearer and easier to read than passive voice. Emphasize that when you edit your content.
Repeating the same words over and over in content is boring to read. Not to mention, it looks like keyword stuffing.
Is “boring to read” the same thing as “hard to read”? Not exactly. But it’s close.
Consider that people who are bored with your content probably won’t stick around to read all of it. They’ll bounce.
That’s why mixing up your vocabulary can improve your writing. It livens up your sentences and makes them more engaging.
5. Use lists
Lists are a skimming reader’s best friend.
And if your content is easy to skim, it’s also easy to read.
For this reason, whenever you’re tempted to write a long list of items separated by commas, transform it into a numbered or bulleted list.
You can apply the same technique to:
Steps in a sequence.
A group of related items, ideas, or concepts.
Points in a long paragraph.
Any other information you want to highlight or set apart from the main text.
See what I did there?
6. Give your readers signposts
Content that’s easy to read also makes judicious use of signposts that show the reader the lay of the land.
For example, descriptive headings help your reader understand how your content is organized and what information each section will cover.
Selective use of bold text helps highlight important words, ideas, or phrases your reader should pay attention to.
Another great signpost for long-form content is the humble table of contents. This helps your reader jump around in your article to the information they most want to read.
Here’s a good example of a blog with a table of contents by Ahrefs – a brand that uses them often:
7. Avoid jargon and industry-speak
“Our goal was to drive more traffic to the landing page and ultimately earn ROI through sign-ups.”
Do you understand what the above sentence is saying?
If you do, you might be a marketer.
If you don’t, welcome to the world of industry-ese (also known as jargon or industry-speak).
This is the insider language that people who work within the same niche or industry use when they speak to each other.
To everyone else, it sounds like gibberish.
Using it in content that’s supposed to be targeted to your audience is a cardinal sin. Because unless you have a specific exception, your audience does not speak like you and your colleagues.
8. Format your pages with plenty of white space
The responsibility for this one might rest with your website designer, but it’s important. Ensure your pages have plenty of white space around the content and text.
This is simply the empty space between the elements on a page.
This “room to breathe” makes your pages easier to read because the page elements won’t be crammed together.
9. Check your content by reading it out loud
One of the easiest ways to check your content readability is to read it aloud.
It may feel silly, but you’ll quickly discover how different your content sounds out loud vs. in your head.
When you read it out loud, you’re more likely to stumble over complex sentences and paragraphs or to notice when your words get all tangled.
When you come across these instances, try to rewrite them more simply. Smooth them out for ease of reading.
Try it. It might change how you edit content.
Improve your content readability for better results
Content readability is a big deal.
When your content is readable for your audience, they’ll have an easier time getting value out of it. They’ll learn from it, glean something new, or get the answer they were looking for.
On the other hand, content that’s hard to read will stop them from doing any of the above. It will bore or frustrate them.
And a bored, frustrated audience won’t stick around. That’s the antithesis of content marketing.
Work on your readability, and you will see better results.
Paid search spend is expected to reach $110 billion this year, according to a new eMarketer forecast.
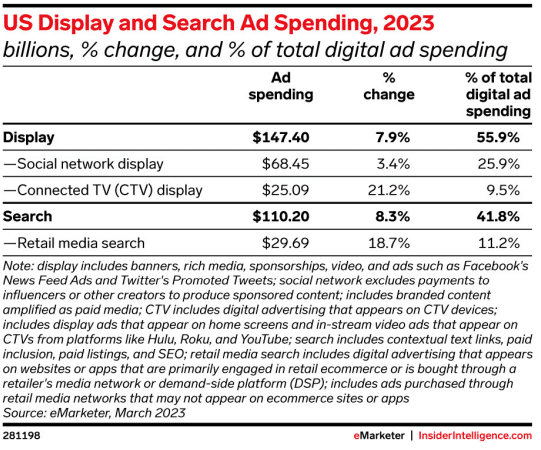
Search and retail media. Paid search represents 41.8% of total digital spending. If it reaches $110 billion, its growth will remain slightly higher (at 8.2%) than overall U.S. digital ad spend, which is expected to increase by 7.8%.
Within search, retail media networks (RMNs) are a rising star, with 18.7% growth in retail media search. This segment is projected to be near $30 billion in spending in 2023.
RMN digital ad revenue (not just in search) is on course to rise from $31 billion in 2021 to $45 billion this year. If spending continues at its current rate it should surpass $106 billion in 2027.
Image source: eMarketer
Why we care. We expect 2023 to be a challenging year in search. There have been many changes related to generative AI and chat in search (both on Google and Microsoft Bing), and we’re hoping to get more clarity soon about what these changes will mean in terms of engagement and ad performance. Until then, it’s good to see overall paid search spend growth rising – especially in retail.
U.S. digital ad spend. While it’s dropping below 10% for the first time in 14 years, digital ad spending is projected to rebound to 11.2% growth in 2024, the forecast said. Yearly increases are predicted to hover around 10% through 2027.
Digital ad spend saw a dramatic rebound in 2021 following the initial wave of the COVID pandemic — when it saw growth of 37.6%. In 2022, the numbers fell dramatically, with 10.6% growth.
Image source: eMarketer
Digital slice of the pie. Overall media spending is expected to increase 3.8% this year as traditional media investments continue to migrate to digital.
Digital media should make up 74.6% of total U.S. media spend, which is expected to reach nearly $264 billion in 2023. The digital slice of total media spending is projected to grow about 2% annually in the coming years.
Display and CTV. Connected TV (CTV) advertising keeps charging ahead.
For some perspective, over half (55%) of digital spending is in display ads whose revenue is expected to grow 7.9% this year. CTV’s projected growth for 2023, however, is 21.2% – nearly triple digital’s growth.
CTV ad spend is on pace to hit $25 billion this year and account for 9.5% of total digital ad revenue, according to eMarketer.
Social display, on the other hand, is projected to only see a growth increase of 3.4% in 2023. Social network display advertising is about a quarter of total digital spending.
The Privacy Sandbox initiative, a project led by Chrome, is introducing new key relevance and measurement APIs to Chrome Stable. This move is scheduled for the third quarter of 2023, with the spotlight focused on Chrome Stable 115 as the specific launch pad.
Unveiling the specifics. The APIs set to go live are:
Topics: Generate signals for interest-based advertising without third-party cookies or other user identifiers that track individuals across sites.
Protected Audience: Select ads to serve remarketing and custom audience use cases, designed to mitigate third-party tracking across sites. (This API was previously named FLEDGE. As we head towards launch, we’ve updated the name to better reflect the functionality.)
Attribution Reporting: Correlate ad clicks or ad views with conversions. Ad techs can generate event-level or summary reports.
Private Aggregation: Generate aggregate data reports using data from Protected Audience and cross-site data from Shared Storage.
Fenced Frames: Securely embed content onto a page without sharing cross-site data.
The APIs will gradually roll out to all users. The Chrome team to closely monitor for issues to ensure a seamless integration.
Why we care. The six new relevance and measurement APIs will deliver tools to generate interest-based advertising signals and correlate ad clicks or views with conversions, all without the use of third-party cookies. This approach not only offers more privacy-focused methods for ad targeting and measurement but also prepares advertisers for a future where third-party cookies may no longer be viable.
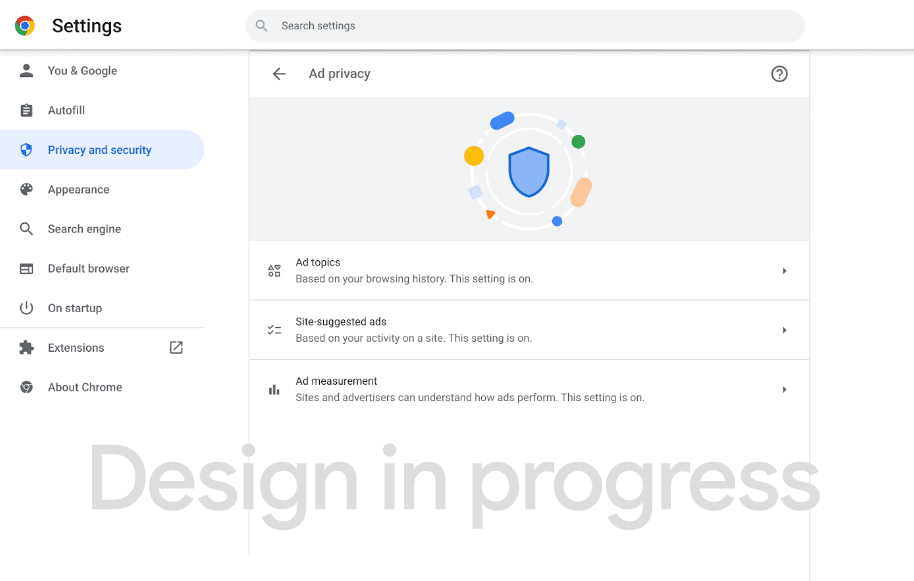
Updated user controls. A major improvement with this launch is the addition of advanced Ad privacy controls. These controls offer users more granular management of the new APIs, providing an extra layer of privacy and giving users control over their browsing experience.
Here’s what the new user controls may look like:
Test version of an updated Chrome Ad privacy interface.
Open application dates. To handle the expected developer interest, an enrollment process has been created. Starting in June, developers can apply for API access, which will be granted in August. This ensures a controlled and organized introduction of the APIs to the wider developer community.
General Availability (GA), as it’s referred to in the project timeline, implies that these APIs will become available by default in Chrome. However, immediate availability in all Chrome browsers is not guaranteed. The gradual rollout strategy will allow users to directly control the activation of these APIs.